The Hidden Cost of Delayed Contamination Detection in Subsurface Environments
When a chemical processing site suspects an oil leak, the real question is not whether contamination exists—it is how far it has spread and how deep it has migrated before anyone notices. Traditional environmental assessment often relies on scattered borehole sampling, a method that can be slow, expensive, and prone to missing contamination plumes that move between sampling points. This gap is precisely where automated soil and groundwater pollution monitoring has become an important operational tool for environmental engineering firms, mining operators, and infrastructure managers.
Subsurface pollution rarely announces itself. Oil leakage, landfill leachate, and dam seepage can move gradually through soil and rock layers, often undetected until surface symptoms appear—by which point the scope and cost of remediation may have increased. The industry's core challenge is closing the gap between when contamination begins and when it is actually identified, mapped, and acted upon.
Why Detection Timing Determines Remediation Cost
Why Does a Delay in Detection Change the Scope of a Cleanup Project?
The financial and regulatory consequences of subsurface contamination can increase as the affected area expands. A leak that spans a few square meters at shallow depth may be more readily contained; the same leak left undetected for months can spread laterally through soil layers and vertically toward groundwater, turning a localized issue into a broader remediation project. Manual sampling campaigns, which depend on physically drilling and testing at discrete points, are inherently limited in their ability to catch this progression early.
Three factors complicate traditional detection: labor-intensive field logistics that limit how frequently a site can be resurveyed, high-interference environments such as urban infrastructure, mineral-rich soils, and moisture variability that can complicate data interpretation, and the simple reality that pollutants such as dynamic oil plumes or landfill leachate do not move on a schedule convenient for periodic manual inspection. For dam operators specifically, seepage tracking carries an added safety dimension—undetected seepage pathways may compromise structural integrity before visible signs emerge on the surface.
How Automated Soil and Groundwater Pollution Monitoring Works
Addressing these limitations requires shifting from discrete manual checks to continuous, instrumented observation. Electrical Resistivity Tomography (ERT) is one technique used for this purpose, mapping subsurface resistivity variations that may be associated with contamination boundaries, moisture content, and material composition.
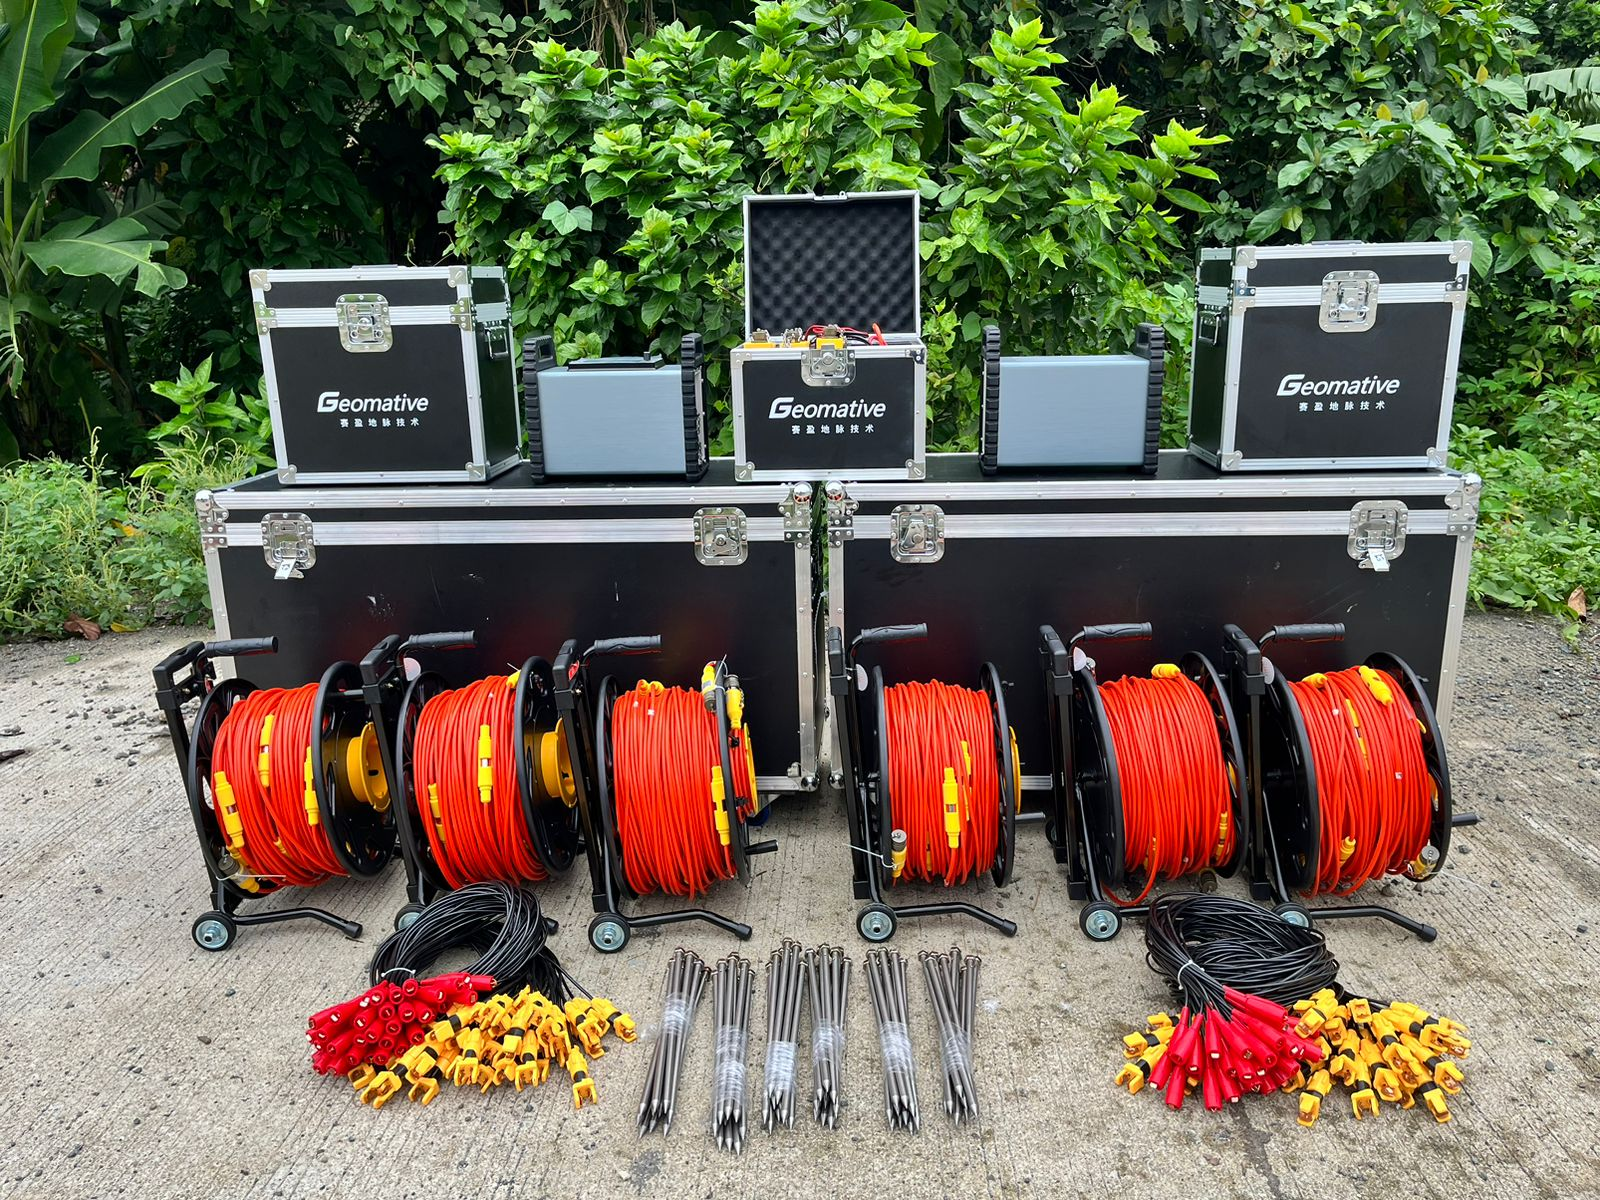
The Geomative GD-20 adopts an independent 5- or 12-channel architecture and supports acquisition through up to 10 ERT measurement channels. According to Geomative, its multichannel design can increase average field-testing efficiency by approximately two to three times compared with single-channel equipment, helping reduce field time and labor requirements. The system can support 3D ERT and IP surveys, subject to the selected configuration and field layout.
For sites requiring investigation in hilly or geologically complex terrain, resistivity systems can support subsurface characterization and help identify structures relevant to groundwater and contamination studies. Effective investigation depth depends on electrode spacing, array configuration, transmitted current, ground resistivity, environmental noise, and site conditions, rather than on a fixed depth guarantee. Field data can be reviewed and managed through acquisition software such as Geomative Studio, which supports survey-script configuration, data-quality review, and export. Subsequent inversion, modeling, and interpretation may require compatible specialist software and professional geological analysis.
The second layer of automated soil and groundwater pollution monitoring extends beyond periodic surveys into persistent, unmanned observation. IoT-connected online resistivity monitoring equipment and compatible sensors, paired with cloud-based platforms, can support continuous, 24-hour tracking of dam seepage, landfill leakage, and groundwater migration at contaminated sites. Big-data analysis and monitoring rules can be applied to incoming data for early-warning generation. This combination—periodic high-resolution ERT surveys supplemented by continuous online monitoring—helps narrow the detection gap that manual-only approaches leave open, particularly for pollutants that migrate dynamically rather than remaining static.
Because resistivity anomalies are not unique to contamination, ERT results should be interpreted alongside site history, hydrogeological information, borehole observations, soil or groundwater sampling, and laboratory testing.
Measurable Outcomes: From Contamination Mapping to Site Remediation Planning
The practical value of this monitoring approach is illustrated through field application. In one oil-pollution investigation at a chemical factory, an ERT survey using the Wenner-Schlumberger array identified an interpreted anomalous area of approximately 1,287 square meters. The average anomaly depth was estimated at approximately 3–7m, with the deepest interpreted extent reaching about 12m. These results provided a spatial basis for planning subsequent sampling and remediation, although the resistivity anomalies would still require confirmation through boreholes, soil sampling, or laboratory analysis.
Groundwater investigation applications demonstrate a parallel benefit for resource-constrained projects. In a rural water-supply project in Quezon, Philippines, seven VES survey points were used to identify three priority drilling areas and recommend indicative drilling depths. The investigation helped guide well-siting decisions, although actual aquifer yield and sustainable discharge still required confirmation through drilling and pumping tests.
In India’s Morena District, the GD-10 Supreme+ was used to characterize subsurface conditions in hilly terrain. No major aquifer system was identified within approximately 150m. Based on the surrounding hydrogeological conditions, the project team considered that a confined aquifer might occur at greater depth. The case demonstrates the value of resistivity surveying for subsurface mapping, while also showing that deeper groundwater targets require further geological assessment and drilling verification.
Across these scenarios, the consistent outcome is the same: subsurface information that might otherwise require extensive drilling, time, and cost can be supplemented by non-invasive geophysical measurement. This information can help guide sampling, drilling, remediation planning, and risk assessment when interpreted together with site-specific verification data.
The Strategic Shift Toward Continuous Subsurface Monitoring
As environmental regulations tighten and infrastructure ages, the operational calculus for pollution detection is shifting from periodic compliance checks toward continuous risk management. Automated soil and groundwater pollution monitoring, combining multichannel electrical resistivity surveying with IoT-enabled unmanned tracking, offers environmental engineering firms and infrastructure operators a way to identify contamination and seepage trends before they develop into larger remediation liabilities.
For organizations managing dams, landfills, mining sites, or industrial land parcels, the practical implication is clear: investment in continuous, data-driven subsurface observation can be an important risk-management and cost-control measure rather than only a compliance formality. As field-deployable sensing and cloud-based analysis platforms become more accessible, the gap between contamination onset and detection is likely to continue narrowing across the environmental monitoring industry.
https://www.geomative.com/
Geomative Co., Ltd.